
Client reporting is often a race to mediocracy for pharmacy and PBM organizations. Reports are often manually curated and extremely dense, which can lead to high costs and stretch limited internal resources.
Bringing value and efficiency back
Singular resource expansion rarely solves an organization’s problems. Our reporting solution uses advanced analytics, automation, data management and robust reporting to deliver interoperable insights that are available to the right users at the right time via a range of delivery mechanisms. It enables businesses to improve client relations, broaden operational efficiencies, and grow their bottom line.
Introducing EXLVANTAGE™
Our pharmacy reporting solution is made for all health plans and PBMs. EXLVANTAGE™ is a HITRUST certified healthcare data and analytics platform. It delivers insights that are interoperable, giving healthcare organizations the critical information needed to take action that benefits their business.
Key features
- Provides storyboards that are succinct, easy to interpret, visually stunning, and actionable reports
- Communicate more effectively with clients by giving them access to KPIs and recommendations
- Decrease resource allocation by providing clients with configurable drag and drop dashboards/storyboards based on relevant KPIs that fulfill most of their reporting needs
- Free up internal resources by limiting manual intervention and providing automation
- Increase ROI by leveraging advanced analytics to determine where highest impact and most intervenable contributions can be achieved
Advanced analytics
Our reporting solution analyzes data and uses predictive modeling to help guide decision making. It’s a robust tool that factors in as social determinants of health (SDOH) and member engagement, ultimately driving better efficiencies for an organization. Examples of the tool’s capabilities include:
- Identifying patients who impact ROI the most
- Increase efficiency in value based care
- Identify and compare cohorts for interventions
- Measure cost, quality and risk outcomes and use credible statistical methodologies to demonstrate ROI
Automation
Maximize ROI and efficiencies by automating processes and work flow:
- Automatically stratifies and disperses work loads
- Automates the communication of clinical/adherence programs through IVR, SMS, email and surveys
- Builds custom workflows for clinical/ adherence programs
Data management
Deliver a solid foundation for efficient growth with its robust data management process:
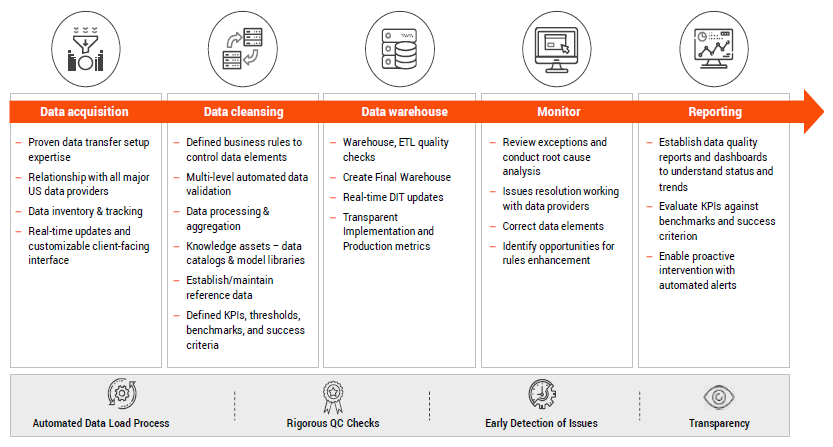
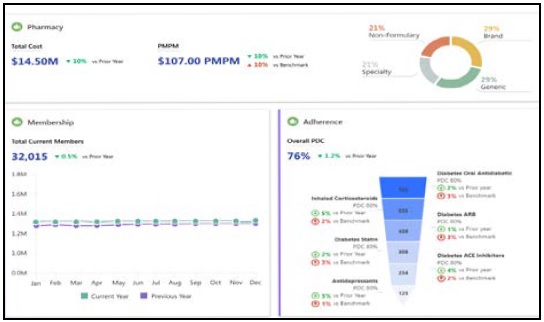
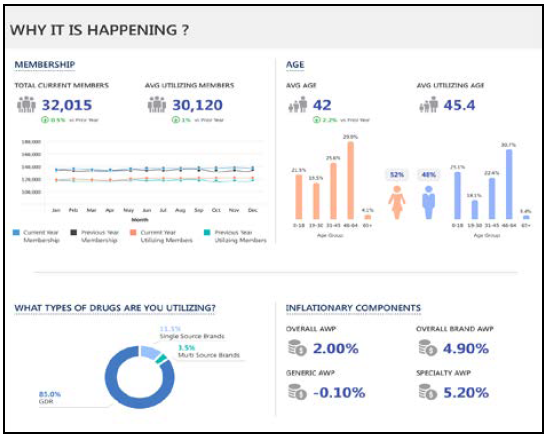
Focused reporting
Deliver focused, persona-based reports in a variety of formats. Showing clients exactly what is happening, why it’s happening and what they can do about it, our solution provides reports that limit manual intervention, decrease resource allocation and fulfill most reporting needs. Reports include:
- Pharmacy spend and utilization
- Indications dashboard
- Clinical programs
- Track outcomes and effectiveness of clinical programs
- Adherence reporting
- Track outcomes and effectiveness of adherence reporting
User focused
Our tool provides reports that satisfy the needs of a wide range of users, including executives, insight generators, and power users.
- Understand future spend and potential savings
- Compare benchmarks
- Create custom views and reports
- Perform ad-hoc analysis
- Analyze long-term effects of disease on cost
Multiple formats
Modern, modular, and refreshed on demand, these reports provide easy-to-interpret insights that help clients improve ROI.
Scorecard
Configurable, drag-and-drop dashboards that monitor specific activities. Users can:
- Select relevant KPIs
- Easily find areas needing attention
- Drill down for more details
Storyboards
Succinct, visually stunning reports that tell a complete story. Users can:
- See curated insights mapped to actions
- Deep dive into areas of focus that are backed by industry research
- See what is happening, why it’s happening and what they can do about it
Client branded reports
Highly customized reports that put the client in the driver’s seat. The robust toolkit lets them:
- Perform self-service analytics
- Create drill downs and hierarchies
- Segment geographically
- Define trend lines and forecasting
- Create individual reports, dashboards and maps