Evolving data solutions to support insurer analytics adoption in the Lloyd’s London market
Data is essential for any organization – a fact confirmed by recent research from Lloyd’s. The latest Blueprint II report, a forward-looking report on the digitalization of the insurance industry released by Lloyd’s, reaffirms this fact that data is at the forefront of growth and innovation in the dynamically evolving insurance industry. While there is much focus on data management methodologies and standards, some key elements for growing into a successful data-driven business are often overlooked. These include following the right approach and combining the right skills with cost-effective tools and technologies to transform raw, siloed data into usable information. Untapped treasure troves of data have the potential to generate multi-fold value across the organization by redefining risk evaluation, enhancing customer experiences, and provide a true picture of the health of the organization through a robust and reliable solution.


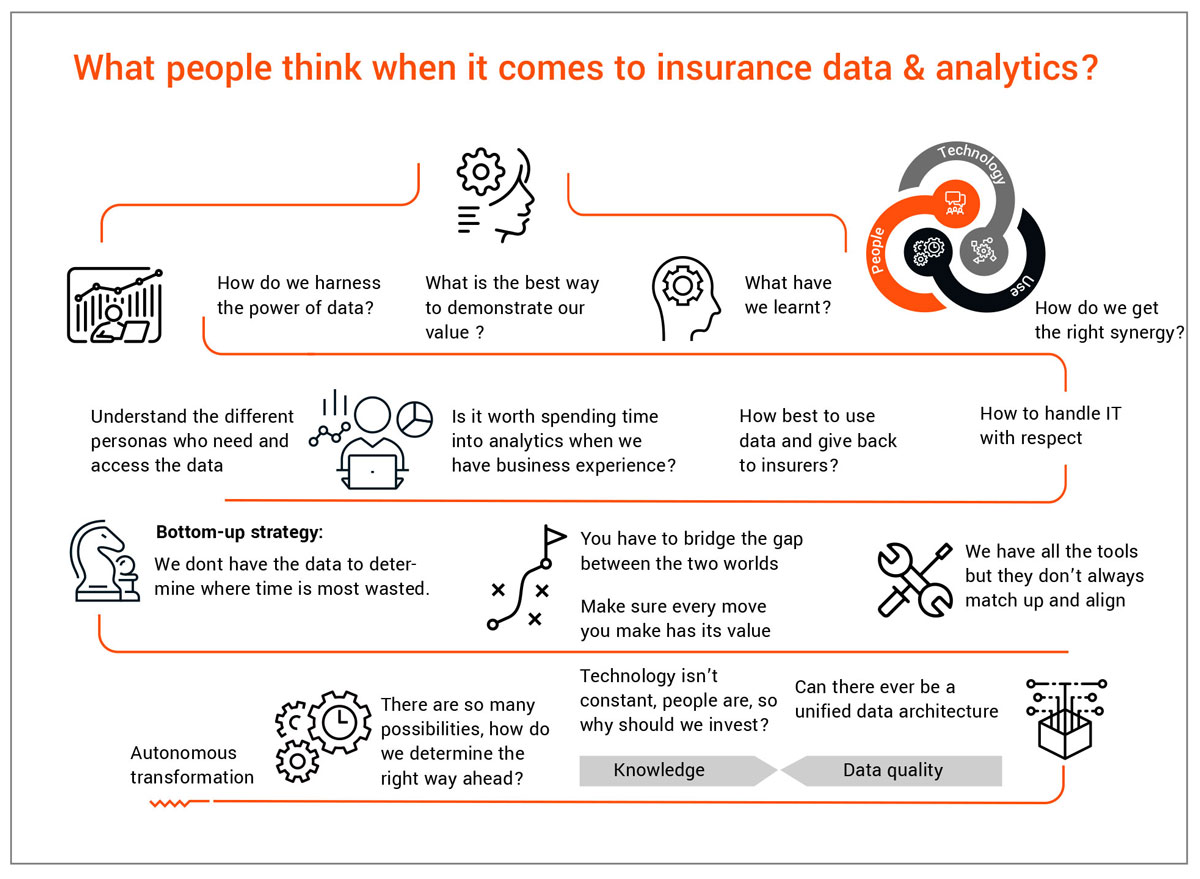
As this focus increases, so do the set of challenges that come with it, with some common issues including heterogeneous systems, unstructured data, reliance on analogue or paper-based processes, lack of data governance, inefficient processing methodology, and high maintenance requirements.
This paper highlights key elements of an insurer’s data modernisation journey that would help unlock and enhance advanced machine learning and analytics capabilities within the commercial & specialty segment of the Lloyd’s London market and, in turn, lead insurers towards a sub-90% combined operating ratio (COR). It includes a brief view into the differentiated approach being adopted by some insurers to build a data and analytics powerhouse through a simplified data operating model while ensuring that all the relevant regulatory, audit, and privacy expectations are met. The approach aims to help achieve cross-functional synergy across currently disjointed pricing, underwriting, claims, and distribution networks while also following Lloyd’s vision for an automated, datafocused future for the Lloyd’s London market.
“Data-driven syndicates are increasingly taking top quartile positions. Having worked across both advanced global personal line insurers and tailored specialty syndicates, the pattern for success is consistent. There is no escape from building trusted data fundamentals and taking all business functions on a journey to use data in their everyday decision making.
Often the data world can appear opaque, complex, inconsistent, and unattached from everyday business activities. It is the responsibility of all c-suite members, guided by the CDO, to simplify this landscape and engender consistency and data ownership within their respective areas such that the insights excite and provide passion for data exploration. Trust is at the heart of this journey, often missed through the natural tendency for a technical focus. Trust evolves through joint strategic goal engagement, data skills training, and empowerment of the business through data partnership across all functions along the customer journey, such as distribution and marketing, underwriting, pricing, risk management and prevention, claims management, and finance.
Only when these data fundamentals are complete can you truly bring the organisation together on a journey of exponential growth through leveraging data. Often analytics functions jump to this stage due to the exciting data opportunities and technology advancements, but these efforts can be hampered through not having developed a data-driven culture.
Once a data-driven culture is in place, leading Lloyd’s syndicates are increasingly able to provide differentiated client services powered by automated data ingestion and risk/loss profiling. These enable, through a trusted relationship, client- and broker-facing functions to focus on value and growth propositions using data insights, moving away from traditionally non-value adding activities such as data entry and report duplication.
At CNA Hardy, having embraced these fundamentals, we now seek to cement our position in the top quartiles of performance and growth, and look forward to this exciting journey using automation and predictive analytics with our trusted internal and external partners like EXL.”
Martin Lynch Director,
Data & Analytics, CNA Hardy
Challenges and the need for modernisation
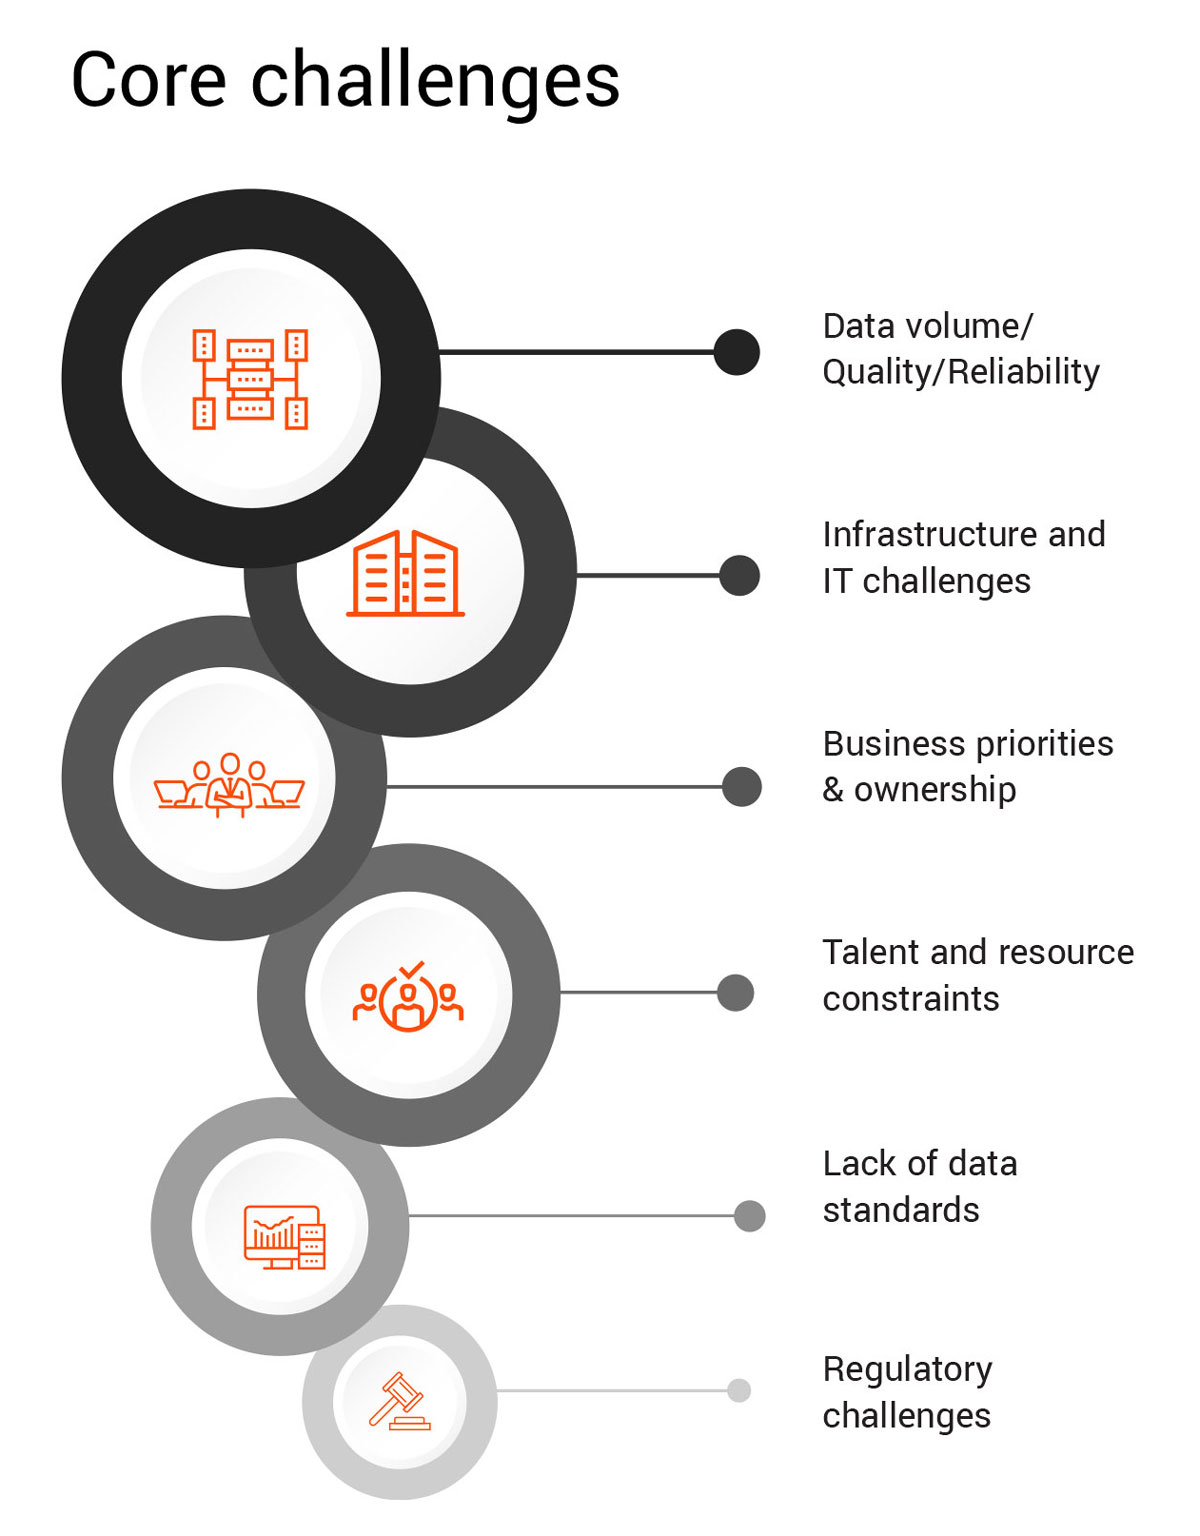
Evolving products, mergers & acquisitions, ever-increasing data volumes, changes in data sources and technologies, and other issues constantly challenge data and analytics programs for insurers. Some of the commonly observed challenges are:
1. Business priorities and ownership:
- Lack of enterprise data strategy: Across the syndicates, determining prioritization and ownership of data modernisation initiatives can present a challenge as business functions tend to work in silos to achieve organizational goals and targets, which can often lead to duplication of effort and competing priorities.
- Business placements: Different levels of data granularity across open markets, delegated authority businesses with their own unique operating methods, and other business placement and underwriting complexities are major challenges.
- Data Ownership: Partially defined ownership of data as it flows through the organization and responsibility as stewards of data whilst under their care.
- Data Culture: Data and Analytics occupies a secondary position to personal experiences, with people relying more on subjective judgements than data driven insights to take business decisions.
2. Data volume, quality, and reliability:
- Data volume and velocity: Typical policy administration, quoting, finance, and other systems hold ever-increasing millions of records, which be difficult to manage if systems and processes aren’t scalable to handle large volumes.
- Unstructured and low-quality data: Millions of unstructured data points through sources like manual sheets, Excel raters, market presentations, statement of values, slips, and binders are not always adequately leveraged. This can result in partial, incomplete, and often incorrectly mapped data. A study found more than 45% of newly created data records had at least one critical error .
3. Lack of data standards
- Data governance: Business rules and definitions are often interpreted differently across business functions with no standardisation.
- Minimal data validation: The complex web of extraction-transformationloading (ETL) processes can lead to a combination of incompatible, duplicate, and incorrect data passing to end business users and regulators. For example, inadequate input data validation results in reserve and cash reconciliation differences leading to increased efforts and delays in Brexit Part VII submissions.
4. Infrastructure and IT challenges
- Heterogeneous data systems: Firms with multiple entities often face the challenge of each entity running their own bespoke systems in parallel, which often differ in technology, architecture, and data model. This can further aggravate the complexity of managing risks and legacy data systems incompatible with modern cloud architecture.
- Data integrity: Multiple ETL efforts to make sense of the numerous data sources including internal databases, individual files, manual sheets, and thirdparty data can lead to data disparity, aggravated by sporadic manual data processing. A recent survey from Corinium found that 80% of chief data officers have data quality issues that interfere with integration.
5. Talent and resource constraints:
A lack of skilled individuals who can effectively develop the necessary data estates or leverage data for business intelligence, predictive analytics, machine learning, and AI often presents a challenge. The current job market within the data and analytics segment is witnessing a massive uptick in demand against a limited supply of highly-skilled resources, which comes at a high cost due to inflation.
6. Regulatory constraints throughout the distribution chain:
Properly understanding and handling data flows across brokers, the insured, re-insurers, and third parties is a critical issue due to regulatory constraints and requirements which are constantly evolving. Changes due to IFRS 17, Brexit Part VII reporting, Fair pricing guidelines, etc. have brought in various challenges.
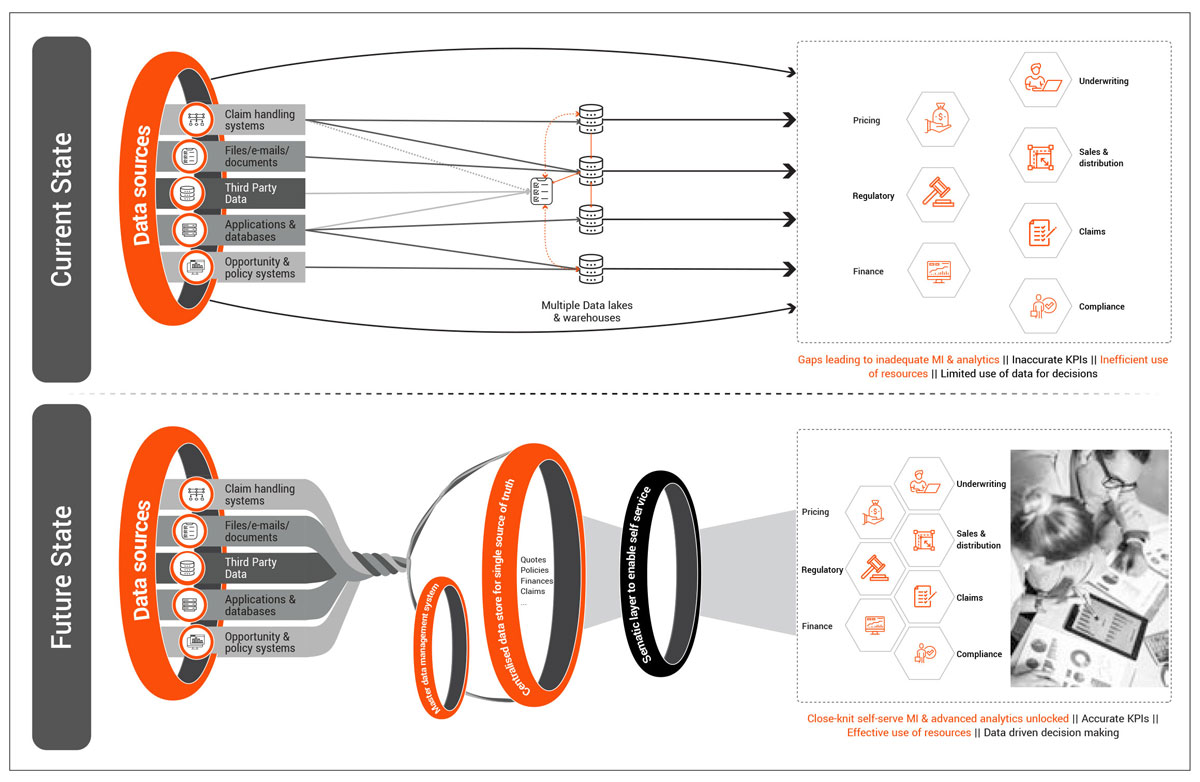
These issues often create a complex architecture with multiple entry and exit points being utilized for machine intelligence and analytics efforts. This can involve many manual processes to conform data, leading to increased required resources, higher error rates, and reduced data quality, all of which limit insurer analytics capabilities. Factoring in ever-evolving consumer risk appetites further makes understanding customers and risk difficult.

Methodology for moving ahead:
Solving these challenges requires a complex yet effective approach to establish a system that is highly reliable, robust, and flexible. Our recommendation follows two mantras:
1. Keep it simple
2. Take your time and do it right the first time
These mantras resonate with the expectations in Lloyd’s Blueprint II. Insurers can build a scalable data solution to support their analytics needs by following a defined approach:
1. Define the data strategy: The backbone of any data transformation journey is defining the end goal. This can differ depending on the scale of operations, determining whether the objective should be business function centric, a unified system, real-time data processing, increasing the level of automation, reporting, and basic or advanced analytics, to name a few. Focus on the use cases that would impact the business the most. This decision will help define the process, tools and technologies, resources, and cost allocation for the project, as well as help convince the business function owners to provide the right sponsorship for projects.
2. Current state assessment and design: Assessing the current data solution can inform the individual elements and any underlying gaps. This assessment output can be used to design the architecture that meets the business requirements and achieves the end goals.
3. Establish data as an asset: It is critical to embed a data driven decision making culture within the organization by establishing the value of data as an asset. This can be achieved by:
a. Implementation of a robust data governance framework that can be scaled appropriately
b. Assigning ownership of data elements
c. Upskilling members across the enterprise to be at par with the dynamically growing world of data and its associated technologies
4. Change management: Set-up a flexible change management process that allows the smooth implementation of data programmes and creates a feedback loop for influencing data strategy.
5. Identify the right cut-off point for legacy data: Based on the volume of data and current business profile, a valid cut-off point should be determined to limit carrying over old, low-value legacy data. This depends on many factors: a. Volume of legacy data
b. Engineering skills required to maintain legacy platforms
c. Interconnectivity and compatibility between legacy and current systems
d. Quality of legacy data e. Continuity of products and processes
6. Employ the right technology and engineering skills: Businesses must identify the right technologies while engaging and developing appropriate resources. This can differ based on:
a. Inter-system compatibility
b. Real-time processing requirements
c. Level of automation
d. Vendor support
e. Security and compliance constraints
f. Level of reporting and analytics
7. Flexible architecture: Carefully design an architecture with the aim of always being in line with the ever evolving technological as well as business standards. It should:
a. Follow a modularized setup for seamless integration of any internal/ external data source
b. Avoid crossovers and overlaps
c. Prevent duplication of any data point across its end-to-end journey
d. Follow a unidirectional flow
8. Modular ETL process: Create a process that can work in modules and reduce interdependency. Establishing the data model so that separate ETL processes are set up for master data management (MDM), core business data (quotes, policies, claims, financial transactions, and others) and third-party data ingestion.
9. Build validation processes for quality control: Start with supervised process to ensure that all data is captured in the right format at the first entry point and further enhance these processes using advanced ML/AI techniques to automatically detect data issues across systems.
10. Adopt the right MDM methodology and standards: Identify all the necessary mappings, and source data only through primary systems unless ingesting thirdparty mappings. It’s also essential to determine the right business owners and use the right technology solution.
11. Dynamicity and code scalability: Ensure a balance between static and dynamic coding practices. Do no over-engineer to create a 100% dynamic solution requiring advanced engineering skills for maintenance, thereby increasing costs. Focus on creating solutions that can be replicated for different purposes with minimal adjustments.
12. End the data journey with a unified semantic layer: While originally a 90s concept, integrating these processes into a semantic layer from the user’s perspective supports both schema-less and schema-based data models. This can be a key piece in creating a data powerhouse and hides the complexity of data models from end users. Semantic layer allows us to eliminate siloed/multi-point reporting and achieving synergy across data definitions; thereby establishing single source of truth across the organisation.
Finally, constantly monitoring the changing market conditions and adjusting for process improvements is essential to always stay at par with the industry.

“As insurers realise the power and potential of data and analytics in the market, there is the trend to rapidly build technical capability and develop ever more complex algorithms and models. Our biggest challenge is making sure our decision makers are brought along in this journey so they can use this capability with conviction. At LSM we’ve been building our Management Information team to take advantage of the skills and flexibility our EXL partners offer us, working together to stay focussed on delivering our strategic goals”
Richard Treagus
Head of MI, Liberty Specialty Markets
Benefits
This approach allows organisations to address their challenges effectively and create data powerhouses which fuel advanced reporting and analytics capabilities that provide multi-fold benefits. Some of these improvements include:
1. Consistency and synergy across business functions: This approach enables handling multiple core systems and sources across business functions by means of a single source of truth, which follows the right data standards, rules, and definitions.
2. Improved data quality: This leads to increased report accuracy, better regulatory and third-party requirement adherence, and increased advanced analytics capabilities to drive efficiency.
3. Better access to information: Easy, automatic access to data through common business terms helps unlock faster machine intelligence builds and self-service reporting capabilities.
4. Reduced engineering skill requirements: A core advantage of this solution is reducing downstream skilled resource and maintenance requirements, better tracking and tracing capabilities, and scalability of coding solutions across different areas.
5. Stepping up analytics: Data-driven decision making and analytics capabilities across different business functions can include:
a. Underwriting, sales, and distribution:
Use cases: Submission triaging, cross- and up-sell, decline analytics, and NTU (Not Taken Up) analytics.
Benefits: Better risk profiling capabilities and reduced turnaround time. This approach has achieved results including 32% submissions prioritized, 15% improvement in average cross-sell premium, and 5% cross-sell opportunity identified from model recommended products.
b. Claims:
Use cases: claims segmentation and triage, adjustor capacity optimization, automated reserve allocation, straight-through processing.
Benefits: Results have included improved claim handling, reduction in claim lifecycle, 3% improvement in NPS, $2M saving from overcharging cases, and a reduction in claims processing headcount.
c. Actuarial:
Use cases: Pricing sophistication, risk selection, cognitive risk analysis.
Benefits: 1-2% improvement in loss ratio, reusable data mart creation, risk mitigation.
Conclusion
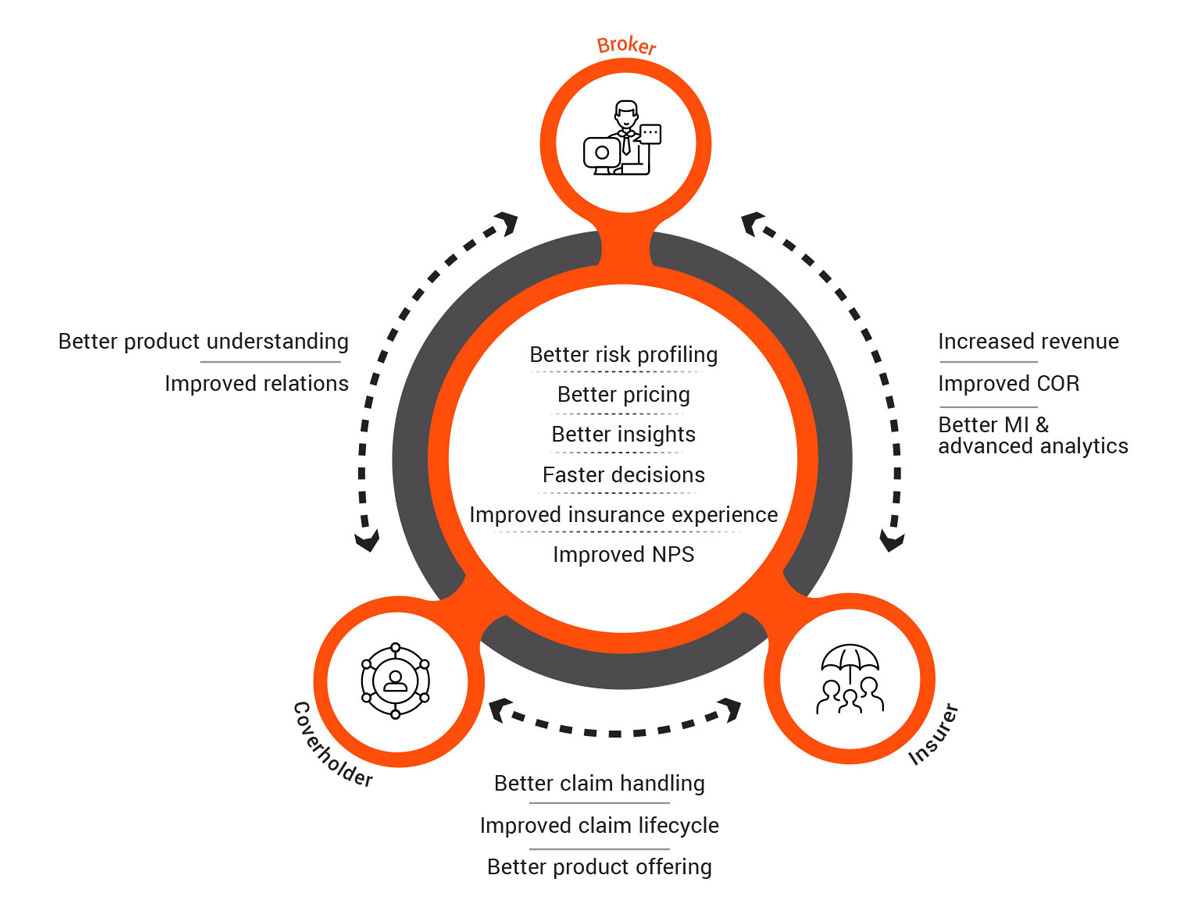
The pathway highlighted in this paper would allow all the Lloyd’s London insurance market players to set up a well-designed data solution to unlock and enhance advanced analytics capabilities, reduce costs, and grow the business. It also enables insurers to have better relationships with members across the supply chain, including with brokers, policyholders, vendors, and improved interdepartmental relations within the business. This would take London one step closer to becoming the most advanced insurance market in the world, competing with our analytics-embracing North American counterparts. Both the businesses and cover holders would benefit from faster turnarounds, better and competitive pricing standards, products tailored to their suiting, a seamless experience of getting insured, and quickly recovering from any future unforeseen losses.
Authors:
Swarnava Ghosh
VP and Head of Insurance Analytics, UK & Europe
Aditya Kumar Dugar
Sr. Consultant, Insurance Analytics
Contributors:
Martin Lynch
Director, Data & Analytics, CNA Hardy
Richard Treagus
Head of MI, Liberty Specialty Markets
