Optimising claims indemnity spend leveraging data & analytics

Our first paper “Claims transformation for general insurers: impacting the right outcomes” presented the ideal outcomes that insurers want to achieve through transformation, while in this paper we focus on one of those outcome – Optimising Claims Indemnity.
Optimising claims indemnity spend leveraging data & analytics
Digitization has become pivotal across insurance business functions to unlock latent value and deliver the best services to customers. There are many new age innovations, in terms of AI/ML, IOT, Process Re-design, RPA and data and analytics, happening throughout the different functions of Insurance like Hyper-personalised customer targeting in Marketing, Automated submission evaluation and quote generation in Underwriting or Use of Computer Vision for damage assessment and claims settlement in Claims.
Our first paper “Claims transformation for general insurers: impacting the right outcomes” presented the ideal outcomes that insurers want to achieve through transformation, while in this paper we focus on one of those outcome – Optimising Claims Indemnity. We analysed the claims function using all lenses to identify opportunities for claims indemnity spend reduction and how insurers can prioritize and implement these initiatives within the constraints of the business
Optimizing claims value chain
There is an inherent pressure on insurers for decline in profitability due to rising claim cost inflation. Claim Indemnity spend is the largest component in the Insurer’s claim cost. For instance, in 2018 alone UK Insurers paid out a total benefit of around £277 Billion in indemnity spend which was 8.6% higher than their cumulative indemnity spend in 20171 . Insurers have been unable to raise premiums in tandem due to high price competition in the market. This gives little leeway for insurers in handling important operations in traditional ways and instead look for new opportunities to reduce indemnity spend. If we take motor claims as an example, claim cost inflation was estimated at 5-8% for 2019 and 8.6% for 20182 as compared to respective previous year. Meanwhile the premium have not kept up with the compounding pressure and fell by 1% in 2019 relative to 20183 . Many external factors like rising part costs, complicated repairs, BREXIT etc. which are out of insurer’s control, contributed towards increase of 11% in repair bills in H1 2019. Less than expected increases in Ogden rate have led to industry wide increase in motor costs, all while simultaneously gearing for upcoming whiplash reforms3 .
Typically, insurers have spent significant efforts in reducing the claims leakage, that have the largest impact on claim performance. Three of the most common we have identified include: failure to detect fraudulent or over-inflated claims, errors in payments made to claimants, and missed opportunities. Traditionally claim processing involved a lot of manual handling due to variety of claims, complex workflows, insufficient and un-organized data leading to high dependency on the knowledge and expertise of individual claim handlers. The claims functions have huge amount of data flowing through them, much of it in unstructured format in claim notes. The key driver for growth in new age insurance is the data and its utilization to unlock new as well as the dormant potential. This requires carefully evaluating the internal processes and the internal/ external data sources; transforming the raw data into meaningful information and generating actionable business insights. This can help insurers generate both efficiency and effectiveness benefits by enabling data driven decision-making.
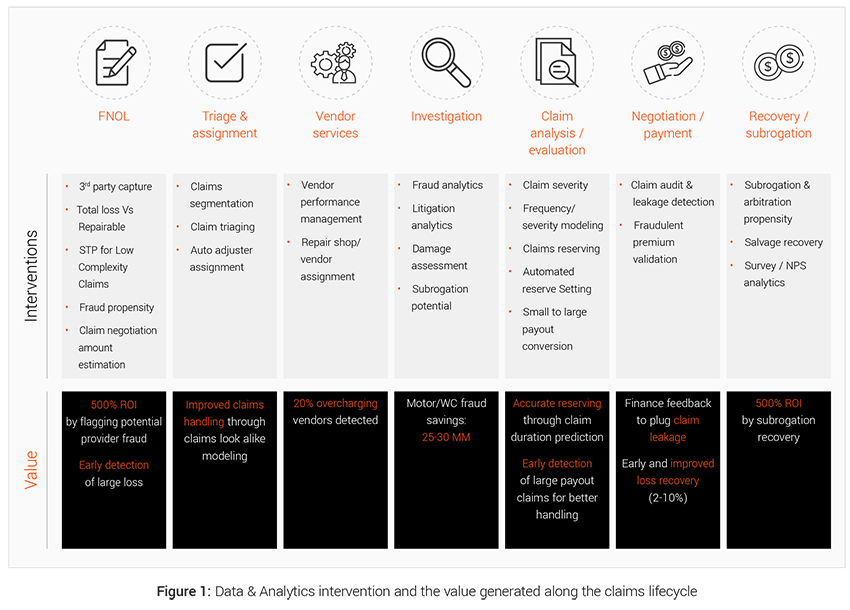
Effective use of data and analytics can generate meaningful impact in all stages of the claims lifecycle as illustrated in Figure 1 below.
EXL’s 4-way framework to Foster indemnity saving in claims value chain
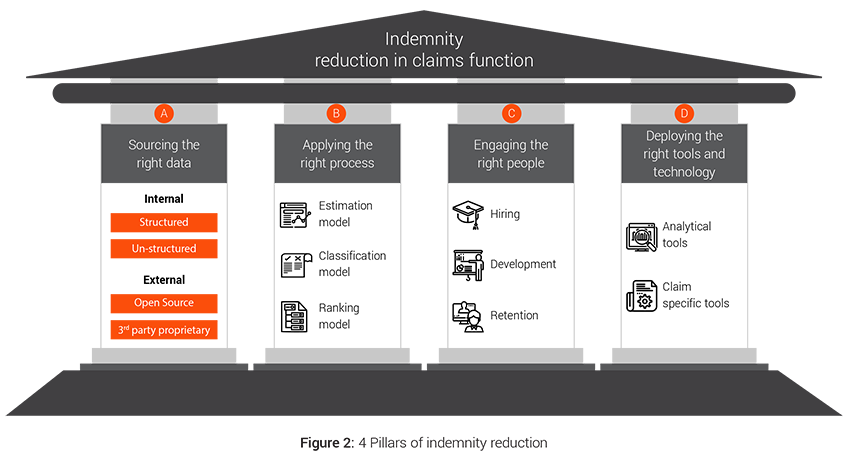
The overall claims transformation approach is further divided into key strategic pillars of data, process, people and technology and a framework that ensures end to end optimization and benefit generation in the claims value chain.
A. Sourcing the right data
There is plethora of data within a claim organization but there is an imminent need to evaluate the accuracy, sufficiency and availability of the data in the desired format. Insurers also need to ensure that the right datasets are shared across functions, data definitions are consistent, privacy concerns are addressed and meaningful insights can be generated from the data.
1. Internal data:
Insurers capture significant amount of data like customer information, quote and pricing information, policy details, claim details, historical fraud cases etc. which they should use for better and faster decision making and enhancing the claims workflow. All internal data sources can be broadly classified into 2 categories based on the format of the data
a. Structured data:
These are well-defined data elements which are present in specific formats in claims and other systems, for example data in excel forms, tabular format, relational databases etc. Such data requires less wrangling and transformation before it can modeled using statistical and machine learning algorithms. The basic flow to implement such interventions would be to source the data, prepare the modeling dataset, formulate hypothesis, test them using various analytical models and deliver the insights in usable formats like reports, dashboards, triggers etc. Structured datasets prepared for certain sub-process such as claim investigation can be used in downstream processes as well as in determining context of other similar claims
b. Unstructured data:
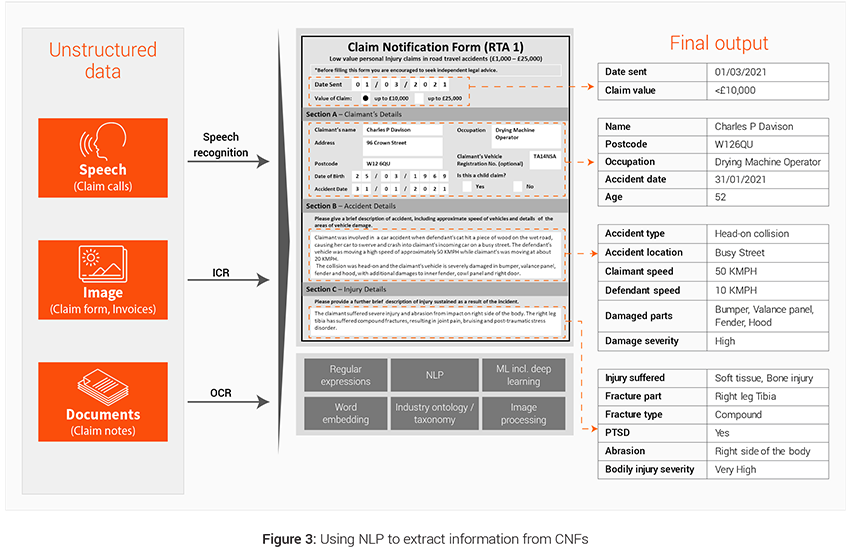
These are aggregation of various data elements in unspecified free flowing formats, for example PDFs, conversations, emails, images, videos etc. These datasets need intelligent programs (like Natural Language Processing or Computer Vision) and tools (OCR etc.) to convert them into structured form and extract information out of it. Claim handler notes and claim notification forms are 2 powerful unstructured sources of data that can be leveraged to generated additional variables used in predictive modeling at different stages of the claims lifecycle. Figure 3 illustrates the use of NLP
Case example: Third Party Capture (TPC)
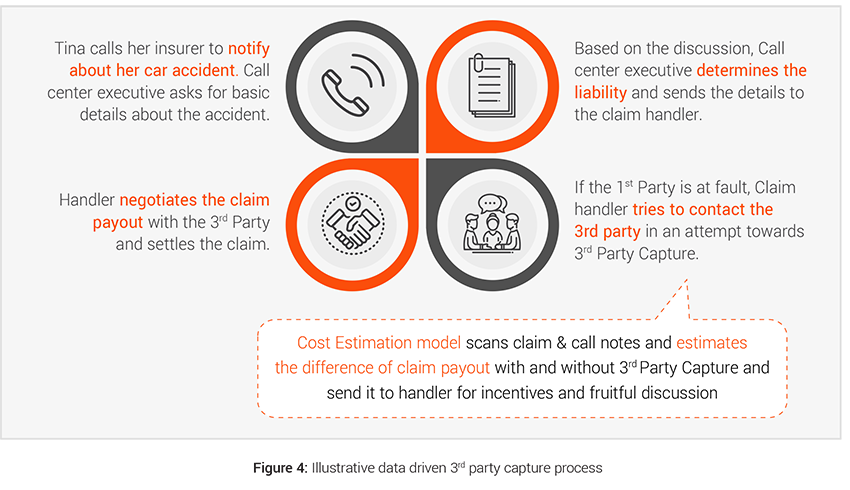
Having control of the vehicle repair process is crucial for insurers to save costs and it starts with an effective third party capture strategy. If the third party is captured promptly and the insurer is able to use their own claim processes then the insurers can save indemnity costs on vehicle repair, car hire, TPI inflation, fraud checks, legal (and legal costs account for more than 10%4 of TPI costs). Insurers can also achieve better customer satisfaction for both 1st and 3rd party by settling the claim quickly and fairly. Therefore assisting non-fault third party for simpler claims becomes more important to control costs and provide better service.
- Challenges: The implementation of Real-Time Cost Estimation Triggers is the major challenge in creating an analytics driven 3rd party capture process. Swift and quick decision making would lead to better conversation management with the customer leading to improvement in 3rd party capture. This real time estimation and decision making can be made possible by leveraging the data present in unstructured format in forms of FNOL call and call notes.
- Analytics solution: Based on our industry experience, customers respond positively to better incentives and faster and fair settlement of their claim. Thus, estimation of repair costs and timelines in real time becomes an important asset to 3rd party capture teams during their conversations with 3rd party customers and allows them to offer accurate repair timelines, relevant incentives, optimal spend range, car hire benefits etc.
2. External data:
In some cases insurers’ internal datasets alone are not robust enough to develop a deep understanding of customers, their behaviors and potential predictors. Data that is not generated internally in claims but can be sourced and is linked to the claims or its processing are useful to enrich the claims dataset and ultimately increases accuracy in decision-making. Some examples of such data include fraud data, third party data, other insurer’s data, external benchmarks, weather data etc. These can be classified into two categories:-
a. Open source:
External data might include information available in public domain like demographic information, customer behavior information from other industries like banking, unstructured content from social media, weather information, catastrophe details etc.
b. 3rd Party proprietary:
There are a few independent external bodies like Resonate by Verisk for Risk profiling, MIB for Motor Insurance data, ABI fraud data, ISO ClaimSearch for fraud detection etc. which collect specific data points related to events in claims value chain. These data sources may be leveraged to bring in the industry perspective and compare performance across peer competitors. These paid data sources could be used to uncover complex and non-intuitive patterns that span across carriers.
B. Applying the right process
Traditional claim processes have largely relied on individual claim handler’s experience and expertise with very limited use of data and analytics. However, with availability of better data and modern analytical methodologies (based on Machine Learning and AI), there is a growing trend of augmenting handler judgements with predictive model based insights. These models can be used for 3 primary purposes:-
- Estimation: Better estimate important parameters
- Classification: Classify instances into broad categories so that insurers can plan accordingly
- Propensity: Help predict events before they happen
1. Estimation models:
These models are used where exact estimate derive the decision making, for example in estimating damage extent, repair costs, hire costs, medical treatment costs , legal costs, recovery amounts, salvage amounts etc. Such models can help to track performance and streamline and optimize efforts internally using the exact estimate from the model. The transformation journey for claims has moved from advanced incumbents adapting to new technologies and models” to mainstream customers adopting these advanced technologies and models.
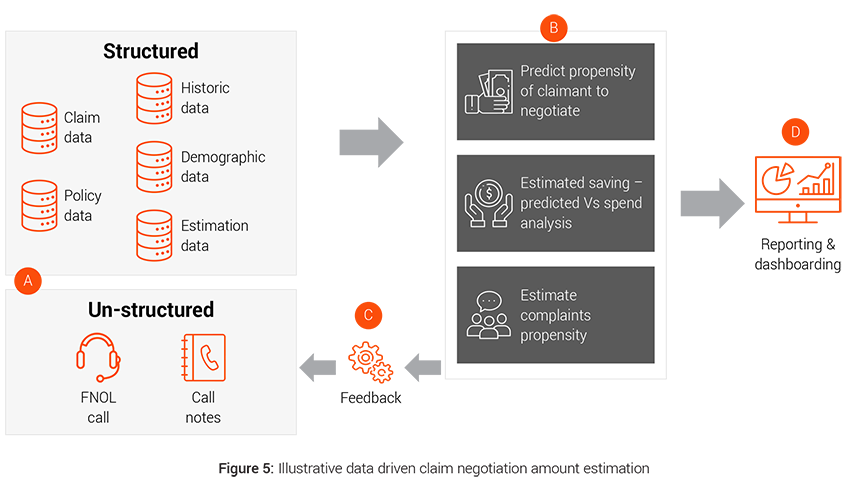
Case example: Claim negotiation amount estimation
Around 90% of the claims are negotiated. Data driven intelligent and customized claim negotiation offer tailored to each customer based on customer’s demographics, solicitor involvement, previous claims history, claims severity etc. can lead to lower claims payout than traditional negotiation approach, which is invariant to customer needs and appetite.
- Challenges: Tracking of customer journey in the negotiation stage and response to each offer becomes important to have an unbiased view of the customer negotiation strategy.
- Analytics solution: Deploying intelligent tools for data capture like speech to text (STT) for voice data coupled with smart algorithms to increase offer acceptability by understanding customer value and demands better.
2. Classification models:
The models which require a binary or multi class decisions like in Repairer Selection need to be done via classification models. These models work by providing a binary or multi-class decision flag, which is used to make decisions and group similar claims together. Insurers can then devise specific strategies to deal with a specific group of claims
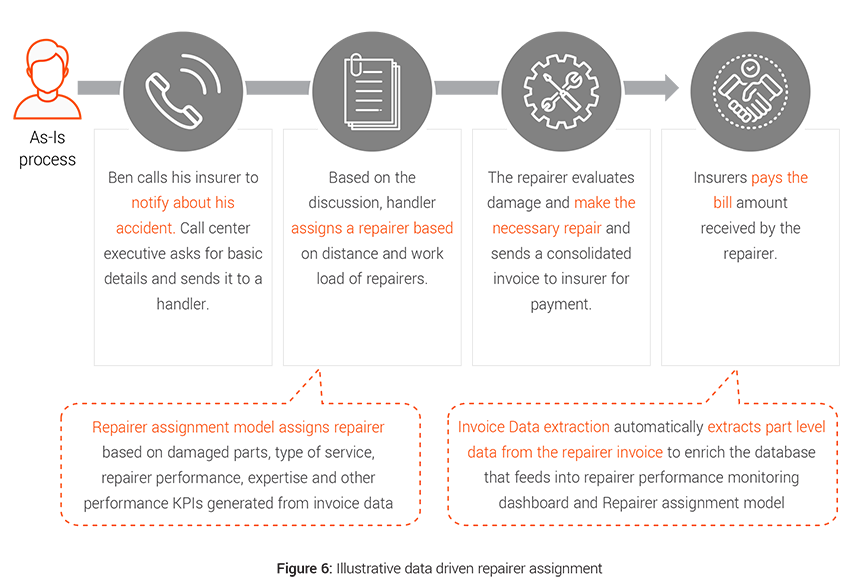
Case example: Repairer assignment
Repair costs are rising, reflecting ever more sophisticated vehicle design and technology, which in most cases costs more to repair when damaged. The 2019 Q1 figures show that the repair bill alone for insurers was £1.2 billion5 . Traditionally assignment of supplier is done on manual judgement which leads to suboptimal assignment at times and thus adds to the indemnity spend for the insurers.
- Challenges: Data capture can be a big challenge here since part level repair details are hard to track as most of the data collected are coming directly from the repairers and insurers have limited control on the process. Also extracting unstructured data from repair invoices adds to the challenge.
- Analytics solution: Better triaging and performance evaluation can result in controlling spend via an approved supplier network and achieve 33% lower cost of claims procurement and add a degree of uniformity in decisions making6 .
3. Propensity models:
These models are used to predict the probability of occurrence of an event like for recovery prioritisation by calculating recovery propensity so as to streamline solicitor’s and handler’s effort on most difficult recoveries and increase recovery rate. These models typically output a probability % that can be used for ranking the events for appropriate action.
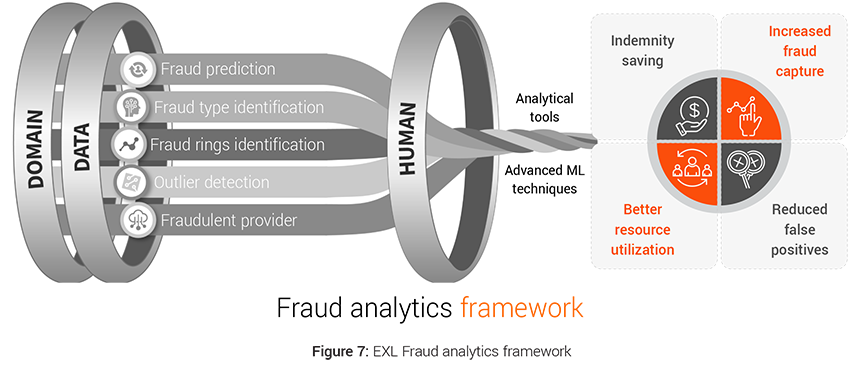
Case example: Fraud analytics
Predetermining fraudulent claims has become important challenge to reduce indemnity spend. The industry spends around £250 million each year tackling this issue7 . There were 107,000 fraudulent insurance claims worth £1.2 billion uncovered by insurers in 2019 up 5% from 2018, with an average value of £11,500 for fraud claims8 . Motor insurance frauds remained the most common, up 6% in number to 58,000 from 2018. Property frauds showed a significant increase too with 27,000 dishonest claims detected worth £124 million – a rise of 30% in number and 8% in value on 20188 .
This calls for a significant overhaul of the fraud capture process by bringing data from various internal and external sources for analysis, performing analysis on the data to see the impact of various data elements on fraud identification, feature engineering the necessary variables and applying advanced machine learning algorithms for intelligent fraud identification.
- Challenges: Fraud has been continuously evolving over the years leading to traditional methods going obsolete. This has led to multiple challenges for insurers in the form of high false positives, unknown fraud types, new and unrecognized fraud patterns etc.
- Analytics solution: The advanced analytics models like Fraud Prediction model, Fraud Type Model, Outlier Detection Model, Fraud Ring Detection Model can:
- Improve fraud capture by identifying subtle or non-intuitive patterns
- Increase precision and coverage
- Optimize the referral rates.
- This results in optimal use of resources to process claims further which previously were wasted and direct indemnity savings from capture of fraud.
Apart from the above 3 models, certain process changes within Recoveries could also create significant impact towards Recovery performance and cycle time. Optimized chase strategy that depends on the Third-Party insurers (TPIs) and bilateral agreements with TPIs has proved successful in optimizing the negotiation process between insurers.
C. Engaging the right People
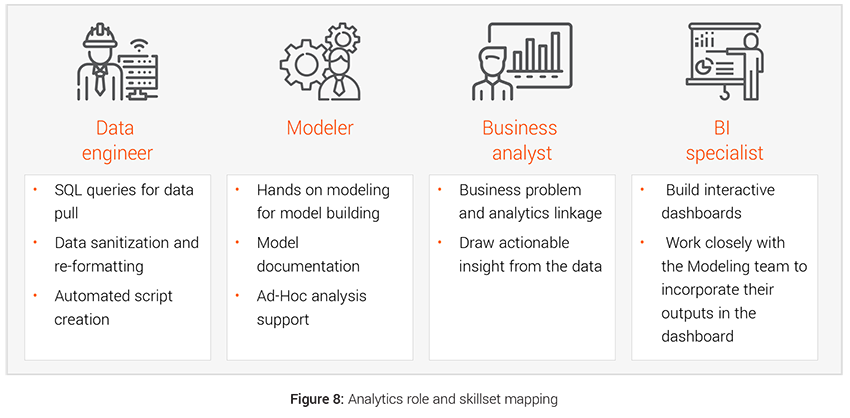
Infusing data and analytics DNA into an organization for achieving lower claims indemnity will require deploying the resources with right skillset and training. Having right skill matched resources to the activities and initiatives will ensure smooth and accurate implementation.
- Hiring: The data driven interventions require hiring right people with dedicated skill set for the transformation like hiring data engineers for faster data management, modelers for bringing the modeling interventions to life etc. Teams with strong analytical prowess, can create significant buzz with use of advanced techniques and tools, and attract better quality talent from the market. We have demonstrated below the four different kind of roles and skillsets that are required to deliver analytical initiatives.
- Skill development: In the Data & Analytics space, human resource plays a very crucial role in generating maximum benefit out of the process. Professional growth through upskilling and cross trainings goes a long way in benefiting both the employee and the employers.
- Retention: Retaining the right talent is key to consistently better delivery. This requires employers to pay proper attention towards their employee’s capabilities development (talent development and skills advancement), support & empowerment (opportunity to work autonomously from end to end on solving problems), work/life balance (enable development while providing time to pursue other interest) and Reward and Recognition programme.
D. Deploying the right tools and technology
Tools and Technology will play a pivotal role in supporting claims processes for achieving transformation. Use of right technology will enable the claims process to operate at maximum potential as well as generate valuable data, which can be used for downstream processes and create additional synergy. Using right technology has a multiplicative effect in infusing data and analytics into the claims function.
Insurers need to select the right tools based on their existing technology stack, business constraints and prioritized list of initiatives that can deliver maximum impact.
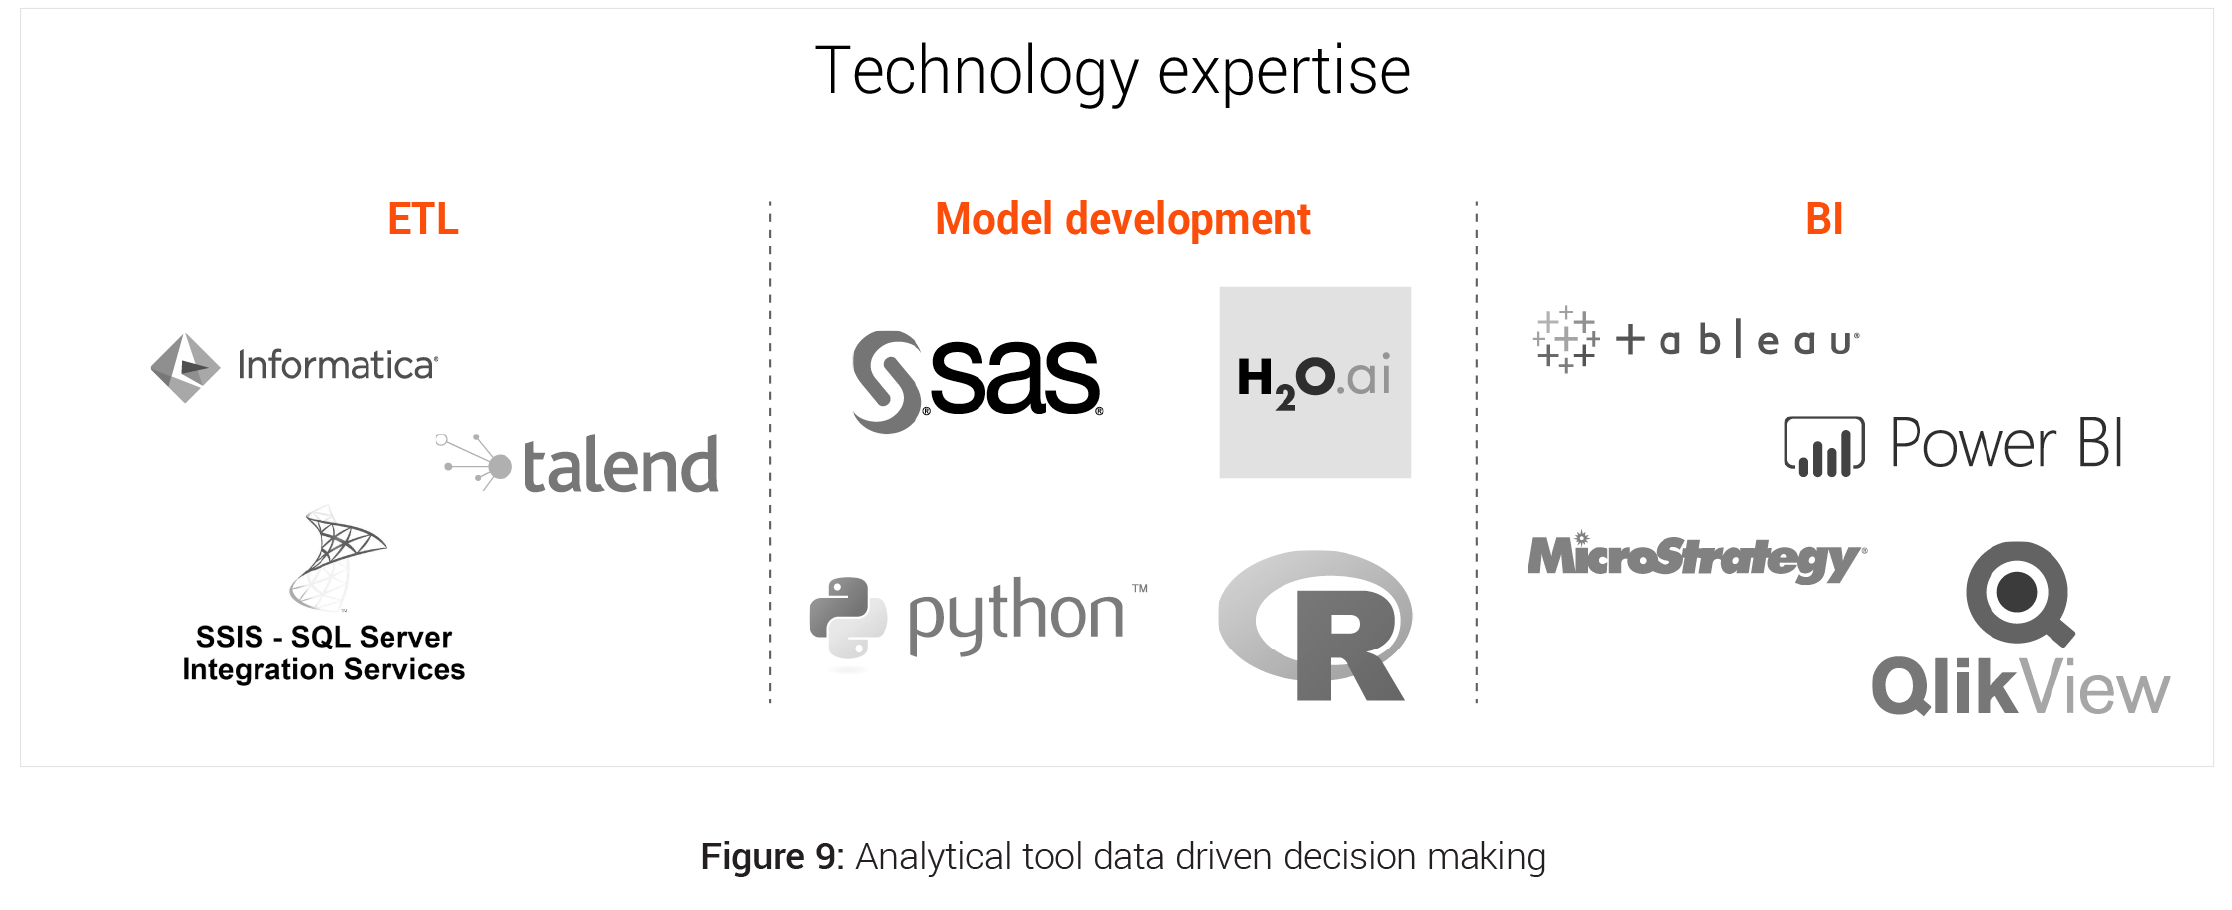
- Analytical tools: There are many analytical tools available in the market for ETL and data management, Model development, Reporting, BI and Visualisation. Insurers needs to analyse the pros and cons of these tools and select the best that caters to their needs and provide the maximum ROI.
- Claim specific tools: There are a number of tools available in the market that are specific to some particular claims function like
- Total Loss Vs Repairable prediction - Tractable, Intelligent Vehicle Inspection, SGS Vehicle Damage Assessment tool, Ravin AI
- Damage Assessment - Claims Outcome Advisor, Claims IQ, Colossus
- Fraud Analytics - Rainbird, Fraudstar, Verisk
These tools bring with themselves in built advance analytical models and huge industry data on which they are trained but lacks insurer specific information.
- IOT devices of Loss prevention and claim avoidance: Insurers can positively impact claims frequency and severity. IOT sensors has moved us from reactive to proactive loss prevention using real-time monitoring. Three areas positioned to make the most impact in this regard are water damage sensors, home exterior sensors and connected cars.
Insurers should evaluate the options to either go for tailored custom-made models on their own data through use of analytical tools or opt for the built in tools present in the market that use the overall industry data.
Project prioritisation framework – What is the implementation roadmap for insurers?
The implementation of data and analytics interventions to achieve lower indemnity spend involves planning project to address several milestones and modelling a solution while minimizing the risk, inducing synergy and increasing the impact.
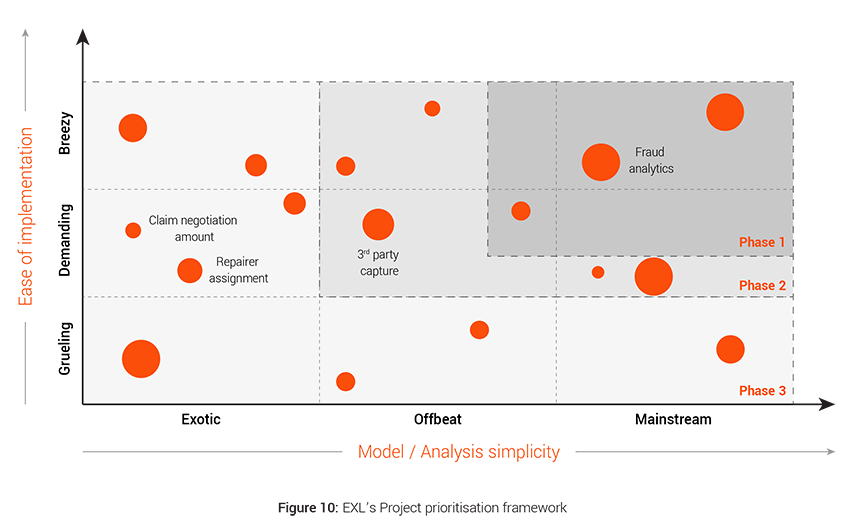
EXL has devised a project prioritization framework that takes into account multiple competing factors to come up with the prioritized list of interventions The framework measures the effectiveness of an initiative on the following parameters:-
- ROI and Benefit Value: A detailed cost benefit analysis is done for each project to calculate their individual Return on Investment and financial exposure. Size of the bubble in the framework depicts the ROI of the individual projects.
- Model / Analysis simplicity: The X-axis depicts the complexity of the modeling technique or analysis needed for a particular intervention. The axis (Mainstream to Exotic) moves across from use of simple regression techniques to complex modeling techniques like image, video, text and speech analytics, natural language processing, deep learning, advanced machine learning and artificial intelligence.
- Ease of implementation: The Y-axis takes into account clear evaluation of IT and data implementation dependencies. The interventions which are easy to implement into the system and do not require any additional infrastructure falls under Breezy and then it moves to Grueling based on the complexity of implementation like for real time implementation, data asset requirement etc.
Apart from these 3 key levers of the framework, insurers should also takes into account few other parameters for project selection and prioritization like:
- Lag period for return generation: This brings the time component of Cost Benefit analysis in the picture and speaks about the time that the intervention will need to show the desired result.
- Extensibility of solution: This brings in the scalability angle of the interventions into picture and talks about the long term goals while taking into account the short term objectives.
- Synergy with ongoing initiatives: It is critical to analyse the interlock of these initiatives with other ongoing projects and determine the impact of such projects on the interventions. There may be value in delaying or accelerating certain interventions if there is strong dependency on ongoing technology projects.
Conclusion
The end-to-end transformation of claims process requires factoring in various decision metrics, dependencies, process flow etc. This can help to ensure that the transformations do not alter the smooth functioning of the existing claims process and impact customers adversely. With the right Data & Analytics strategy in place, insurers can leverage advanced analytics capabilities to ensure significant indemnity saving.
Written by:
Swarnava Ghosh
Insurance Analytics Lead, UK & Europe
Aditya
Analytics Project Manager
Mayank Mahawar
Senior Analytics Consultant